
Product Portfolio Management for Interviews: BCG Matrix, GE Matrix and Portfolio Calls
The biggest myth in product portfolio management is that it is about “which products to kill.” In reality, a portfolio review is where leaders decide which product will get capital, which will get patience, which will fund the future, and which must stop consuming attention.
- Product portfolio management is the disciplined allocation of money, people and attention across a company’s products or business units.
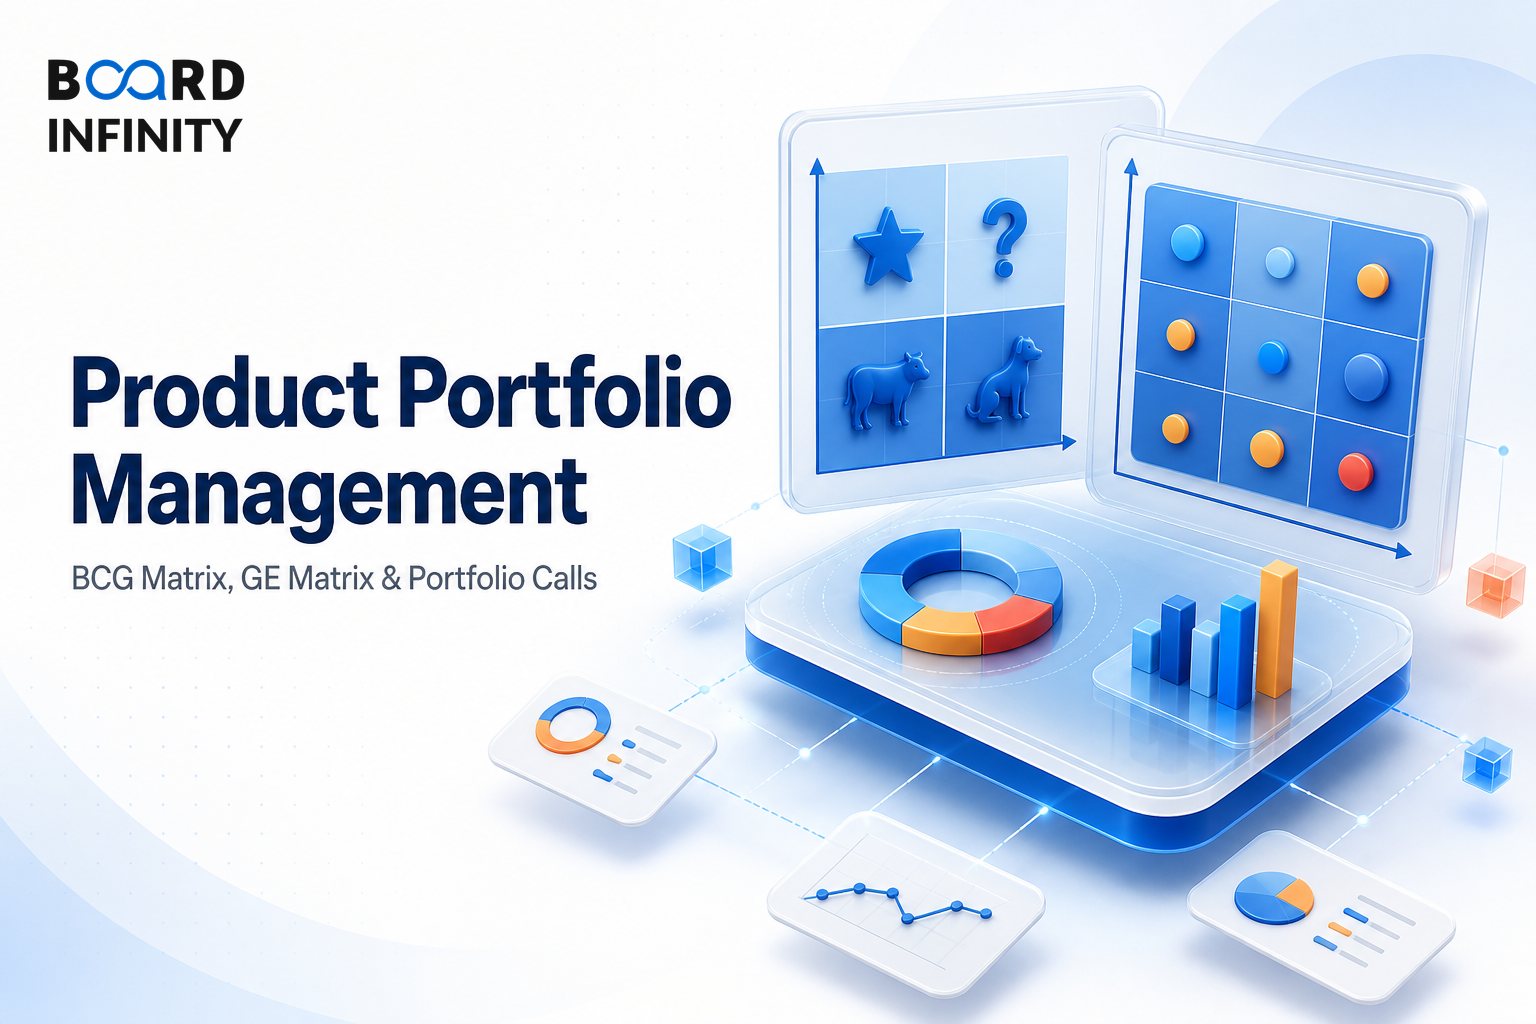
- BCG Matrix uses two variables: relative market share and market growth. It gives four labels: Stars, Cash Cows, Question Marks and Dogs.
- GE-McKinsey Matrix is richer: it scores each business on industry attractiveness and business strength using multiple weighted factors.
- Stars need investment, Cash Cows fund the portfolio, Question Marks need selective bets, and Dogs need turnaround, niche defence or exit.
- Use BCG for a fast diagnostic; use GE when the decision is expensive, multi-factor and strategically sensitive.
- The best portfolio answer does not say “kill all Dogs.” It checks cash, brand role, channel synergy, strategic option value and exit cost.
- Interview structure: define the portfolio, map products, diagnose cash and growth, choose invest-hold-harvest-exit, then name metrics to track.
Big Picture: Portfolio Management Is a Capital Allocation Loop
A product portfolio is not a static chart. It is a repeating management cycle: scan markets, classify products, allocate resources, execute moves, and measure whether the portfolio is becoming healthier.
Core Explanation: The Two Portfolio Maps You Must Know
Product portfolio management answers one hard question: where should the firm put its next rupee of capital and management attention? The two classic tools are the BCG Matrix and the GE-McKinsey Matrix.
1. BCG Growth-Share Matrix: Fast, Simple, Cash-Oriented
The BCG Matrix maps products or business units on two axes:
- Market growth rate - how attractive and expanding the category is.
- Relative market share - your market share divided by the largest competitor’s share, used as a proxy for competitive strength.
ITC is a useful Indian portfolio example because its businesses sit at different points of maturity and cash generation. Cigarettes have historically been a strong cash-generating business, while FMCG, hotels, paperboards and agri-business have different growth, margin and capital profiles. The so what: a conglomerate portfolio is not judged only by category glamour; it is judged by cash generation, strategic fit, risk diversification and the ability to build future engines.
2. GE-McKinsey Matrix: Richer, Weighted and Better for Real Decisions
The GE-McKinsey Matrix improves on BCG by replacing two crude variables with two composite scores:
- Industry attractiveness - growth, profitability, size, competitive intensity, regulation, cyclicality and technology disruption.
- Business strength - brand, share, cost position, distribution, capabilities, customer loyalty and product quality.
BCG vs GE Matrix: When to Use Which
Portfolio Metrics to Track
A portfolio map becomes useful only when it is linked to numbers. Use these six metrics in answers, especially when asked how you would evaluate a portfolio decision.
Worked Example: Scoring a Product in the GE Matrix
Assume a consumer company is evaluating a premium healthy-snacking line. Scores are on a 1-5 scale, where 5 is best.
The industry attractiveness score is 3.25 and the business strength score is 4.05. That places the product in a selective grow / invest zone: invest, but with clear milestones on repeat purchase, distribution velocity and gross margin.
Definitions You Can Say Cleanly
Product portfolio management: disciplined allocation of resources across products to balance growth, profitability, risk and strategic fit.
Kotler and Keller: A product mix is “the set of all products and items a particular seller offers for sale.”
BCG Matrix: a portfolio tool that classifies products by relative market share and market growth.
GE-McKinsey Matrix: a portfolio tool that rates businesses by industry attractiveness and business strength.
Titan: Portfolio Management Beyond One Hero Product
Titan shows how an Indian company can manage a multi-category portfolio across jewellery, watches, eyewear, ethnic wear and digital commerce instead of betting everything on one legacy category.

Situation. Titan began with a strong association in watches, but the long-term opportunity in Indian consumer lifestyle was much wider. Different categories had different economics: jewellery offered a large addressable market and trust advantage, watches faced fashion and smartwatch shifts, eyewear needed scale and retail discipline, and newer bets such as ethnic wear required patient brand building.
The move. Titan did not treat every business equally. It built Tanishq as a trust-led jewellery engine, supported by design, retail experience and Tata Group credibility. It used brands such as Fastrack and Sonata to serve different watch segments. It expanded into eyewear through Titan Eye+, and used CaratLane to strengthen digital-first jewellery discovery and omnichannel behaviour. Newer businesses received selective investment rather than unlimited capital.
Outcome and lesson. The primary driver of Titan’s portfolio strength has been the scale and trust advantage of jewellery, supported by retail execution, brand segmentation, omnichannel capability and a willingness to build or acquire capabilities where needed. The lesson is pure portfolio management: a company’s future is not protected by one successful product; it is protected by disciplined resource allocation across cash engines, growth engines and options.
The strategic so what: Titan’s advantage is not “jewellery alone.” Jewellery is the primary engine, but the portfolio is strengthened by segmentation, retail capability, digital acquisition, trust transfer and selective experimentation.
How AI Changes Product Portfolio Management
AI does not replace portfolio judgment, but it improves the evidence behind the judgment. In 2026, the biggest shift is from annual, backward-looking portfolio reviews to faster, signal-rich reviews.
- Demand sensing: ML models can combine sales, search trends, marketplace signals, reviews and seasonality to detect whether a product is gaining or losing momentum earlier than quarterly reviews.
- Review and social-listening intelligence: LLMs can cluster thousands of customer reviews into themes such as price resistance, feature gaps, packaging issues or unmet use cases.
- Portfolio simulation: AI-assisted scenario models can test what happens if marketing spend, capacity or pricing support is shifted from one product line to another.
Load a company annual report, investor presentation and 3-4 competitor articles into NotebookLM. Ask it to identify the company’s major product lines, classify each using BCG and GE logic, list missing data, and generate five likely interview questions on portfolio allocation.
Interview Relevance
“Suppose you are the product manager for a company with five product lines. How would you decide which ones to invest in, hold, harvest or exit?”
Use both matrices together: BCG gives the first map, GE gives the investment logic. That combination sounds much more managerial than simply naming four quadrants.
Common Mistake
The mistake that sinks candidates is saying “Dogs should always be killed.” That sounds textbook, but it ignores channel support, bundling, brand completeness, cash contribution, exit cost and strategic option value. The one-line fix: “I would not exit a low-growth, low-share product until I test its cash role, synergy role and realistic turnaround potential.”
What to Revise Next
Once you can map a product portfolio, revise how a chosen product is taken to market. Go next to Go-to-Market (GTM) Strategy Fundamentals, then AI-Assisted GTM: Research, Messaging & Launch Workflows so you can connect portfolio choices to launch execution.