
Common-Size, Trend & Peer Analysis: Interview-Ready Framework
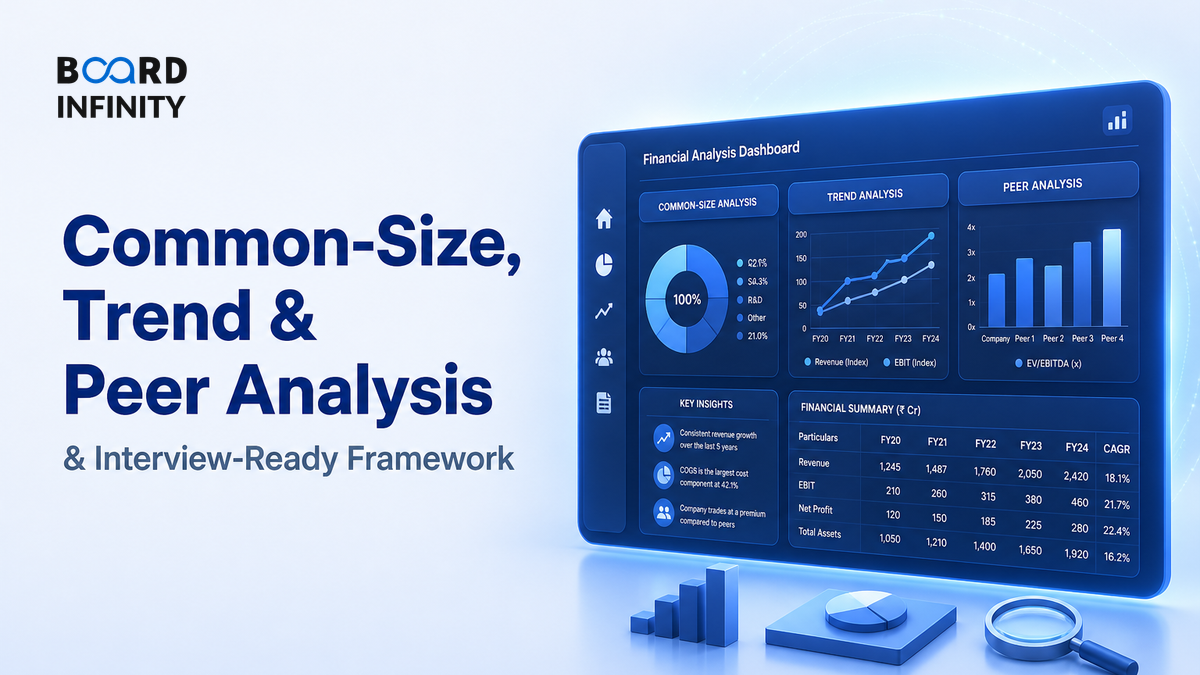
A bank credit team can look at two companies with the same profit number and still approve one loan while rejecting the other. The difference is often hidden in the percentages: one business is scaling with stable margins, the other is growing sales while costs quietly eat the model. Common-size, trend and peer analysis are the three lenses that make that difference visible.
- Common-size analysis converts statement items into percentages, usually of sales or total assets, so structure becomes visible.
- Trend analysis shows how line items move over time using growth rates, index numbers or multi-year CAGR.
- Peer analysis compares ratios with similar companies, so you know whether performance is truly strong or just industry-normal.
- The best answer always triangulates: What changed inside the company? Is the change improving over time? Is it better than peers?
- Use common-size for margin structure, trend for direction, and peer analysis for relative judgement.
- Never compare raw numbers across companies of different size; compare percentages, ratios and business-model-adjusted metrics.
- The killer interview line: "I would not conclude from one ratio. I would check common-size structure, trend direction and peer position together."
The Big Picture
Financial statements give you numbers; analysis turns those numbers into judgement. The ladder below is the simplest mental model: start with reported statements, standardise them, then climb from internal structure to time movement to market-relative performance.
Core Explanation
Common-size, trend and peer analysis are not three separate tricks. They answer three different diagnostic questions:
- Common-size: What is the company made of financially?
- Trend: Is that structure improving or deteriorating over time?
- Peer: Is the performance good relative to comparable companies?
1. Common-size analysis: convert size into structure
Common-size analysis restates financial statements as percentages of a base. On an income statement, each line item is usually shown as a percentage of revenue. On a balance sheet, each line item is usually shown as a percentage of total assets.
Example: If revenue is ₹1,000 crore and cost of goods sold is ₹620 crore, COGS is 62% of revenue. Now you can compare this company with a ₹10,000 crore competitor without size distorting the answer.
Use it to spot:
- Margin structure - gross margin, EBITDA margin, net margin.
- Cost pressure - employee cost, raw material cost, advertising cost as a percentage of sales.
- Asset intensity - fixed assets, receivables, inventory and cash as a percentage of total assets.
- Funding structure - debt and equity as a percentage of total liabilities and equity.
2. Trend analysis: convert time into direction
Trend analysis compares the same company across years. You can use year-on-year growth, CAGR or an index number where the base year is set to 100.
If revenue index rises from 100 to 150 but EBITDA index rises from 100 to 190, operating profit is growing faster than sales. That may signal operating leverage, better pricing, better mix, cost discipline or a combination of all four.
3. Peer analysis: convert performance into relative judgement
Peer analysis compares a company with similar businesses. The word similar matters. A luxury retailer and a value-fashion retailer may both sell apparel, but their margins, inventory cycles, store economics and working capital needs can be very different.
A strong peer set usually matches on:
A Small Worked Example
Assume a company reports the following simplified numbers. All figures are illustrative and in ₹ crore.
The conclusion is not merely "revenue grew." A sharper conclusion is: revenue grew 50% over two years, EBITDA grew 90%, and EBITDA margin at 19% is slightly above the peer median of 18% - suggesting improving operating leverage, assuming no one-off gains are driving EBITDA.
Key Measures to Track
There are no universal "good" ratios across all industries. A strong result means the metric is healthy versus the company’s own history and a properly chosen peer set.
Definitions
- Common-size analysis: Restates each financial statement line item as a percentage of a base item to reveal financial structure.
- Trend analysis: Compares line items across periods using growth rates or index numbers to reveal direction and pace.
- Peer analysis: Compares a company’s ratios with similar companies to judge relative performance, risk and valuation context.
Case Study - Trent Ltd: Reading a Retail Growth Story Properly
Trent shows why analysts must combine common-size, trend and peer analysis before calling a retailer "high growth" or "high quality."

Trent, part of the Tata group, operates formats such as Westside and Zudio. In Indian retail, the headline story is easy to notice: store expansion, rising consumer demand and strong brand recall in value fashion. But a financial analyst should ask a tougher question: Is growth coming with a healthy cost structure and peer-relative advantage?
The move is to read Trent through the three lenses:
The primary driver of Trent’s story has been a scalable retail format mix, especially in value fashion. Supporting drivers include store expansion discipline, merchandising, owned-brand economics, supply-chain execution and working-capital control. The lesson: growth alone is not the story; growth with improving structure and strong peer position is the story.
How AI Changes Common-Size, Trend & Peer Analysis
AI does not replace financial judgement, but it dramatically reduces the time taken to prepare the analysis.
- Automated statement extraction: AI tools can pull line items from annual reports, convert them into structured tables and flag missing or renamed items. The analyst still verifies mapping, especially for exceptional items and segment disclosures.
- Faster peer benchmarking: AI can create first-pass peer tables across margins, growth and leverage. The human task is to reject bad peers and adjust for business model differences.
- Notes-to-accounts scanning: LLMs can identify lease accounting, related-party transactions, revenue recognition policies and contingent liabilities that may distort ratios.
Upload a company annual report, two peer annual reports and your class notes into NotebookLM. Ask: "Create a common-size income statement, identify three trend changes over five years, and list peer-comparison caveats from the notes to accounts." Then verify every number against the PDF before using it.
Interview Relevance
"Suppose two companies in the same sector have similar revenue growth. How would you use common-size, trend and peer analysis to decide which one is financially stronger?"
Use this interview sentence: "I would first remove size bias through common-size statements, then test direction through trend analysis, and finally validate whether the result is strong or weak against true peers."
Common Mistake
The biggest mistake is benchmarking companies without checking whether they are truly comparable. It costs candidates because a wrong peer set can make a weak company look strong or a strong company look inefficient. One-line fix: define the peer set before interpreting the ratio!
What to Revise Next
Once you can read percentages, trends and peers, move one layer deeper into the annual report. Revise Notes to Accounts: The Disclosures Analysts Read First to catch accounting distortions, then study The Annual Report Reading Order: Management Commentary & Auditor's Report to connect numbers with management narrative and audit risk.