
The Yield Curve: Answer Shapes, Drivers and Market Signals with Confidence
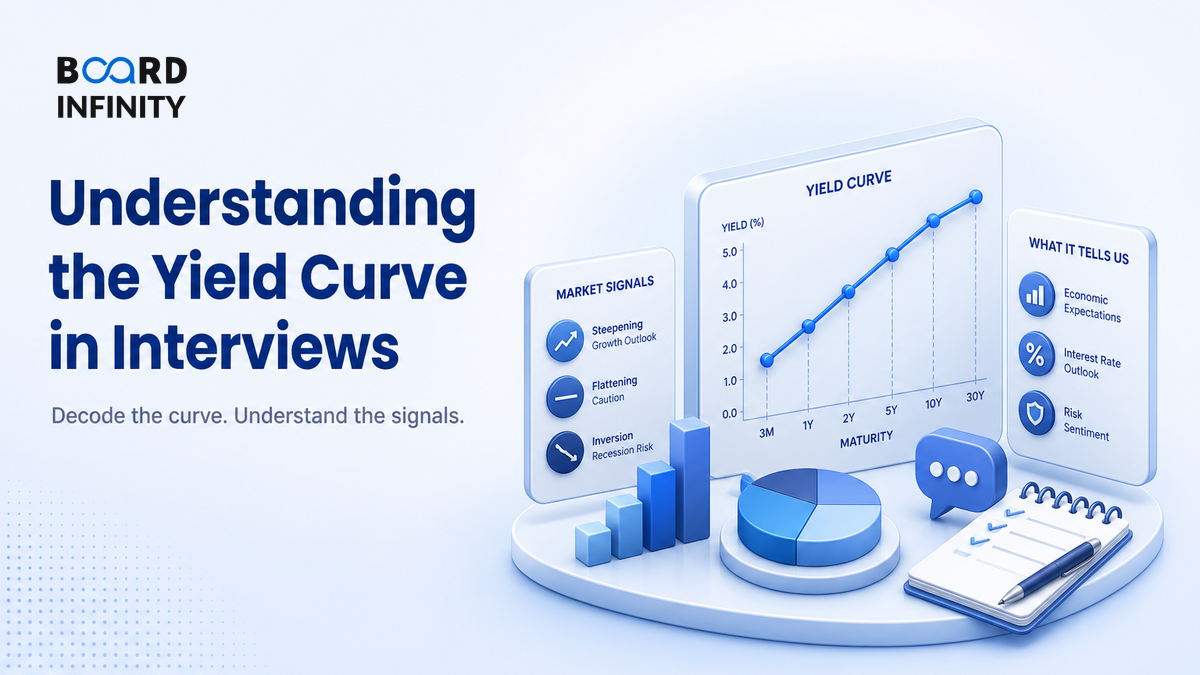
A treasury desk gets uncomfortable before a headline appears. One morning, short-term rates refuse to fall while long-term bond yields soften - suddenly the curve is not just a chart, it is a warning about funding cost, growth expectations and balance-sheet risk.
- Yield curve = yields of bonds with the same credit quality plotted against maturity at one point in time.
- The three quickest reads are level - overall rate environment, slope - growth and policy expectations, and curvature - stress or demand in specific maturities.
- A normal upward curve usually means investors demand higher yield for longer maturity and uncertainty.
- An inverted curve means short yields exceed long yields; it often signals tight monetary policy and weaker future growth expectations.
- Key drivers are central-bank policy, inflation expectations, growth outlook, term premium, liquidity and government borrowing supply.
- For India, read the G-sec curve with RBI repo stance, inflation prints, fiscal borrowing and banking-system liquidity.
- The common interview win: do not just name the shape - explain why it happened, who it affects and what decision follows.
Big Picture: The Yield Curve Is the Market Pricing Time
A yield curve converts the bond market into one visual question: how much extra return does the market require to lend for longer? If short, medium and long yields move differently, the curve starts telling you what investors believe about policy rates, inflation, growth and risk.
Core Explanation: Shapes, Drivers and Signals
The yield curve is usually drawn for government securities because they share broadly similar sovereign credit risk. In India, that means the Government of India G-sec curve - with Treasury Bills at the short end and dated government securities at the medium and long end.
The Four Main Yield Curve Shapes
Interviewers expect you to read the shape, not just identify it. Each shape is a market story about the future path of rates and growth.
The Three Things to Read First: Level, Slope and Curvature
Do not try to interpret every point on the curve. Use a clean three-part lens:
Key Drivers of the Yield Curve
Yield curves move because different parts of the maturity spectrum respond to different forces:
- Central-bank policy: repo rate, liquidity operations and forward guidance mostly affect the short end.
- Inflation expectations: higher expected inflation pushes nominal yields up, especially if investors think inflation will persist.
- Growth outlook: strong growth can lift long yields; weak growth can pull long yields down if markets expect rate cuts.
- Term premium: extra return demanded for holding longer maturity bonds because duration risk rises with maturity.
- Liquidity and supply-demand: heavy government borrowing, index inclusion flows, insurance demand and bank SLR demand can move specific tenors.
- Global rates and currency expectations: in emerging markets like India, US Treasury yields and foreign investor flows can influence the long end.
Metrics You Can Quote Without Sounding Vague
There is no universal “good” yield-curve number across countries because inflation regimes, policy credibility and market structure differ. In interviews, use these measures as directional signals and compare them with their own history.
Worked Example: Read a Curve in 60 Seconds
Assume the following hypothetical sovereign yields: 3-month = 6.80%, 2-year = 6.90%, 5-year = 7.00%, 10-year = 7.25%.
One-line interpretation: This is a mildly upward curve, suggesting the market requires some term premium for longer maturity but is not pricing severe stress at the short end.
Definitions You Should Be Able to Say Cleanly
- Yield curve: a graph plotting yields of similar-credit bonds against their maturities at one point in time.
- Yield to maturity: the annualized return earned if a bond is held to maturity and all payments occur as promised.
- Term structure of interest rates: the relationship between bond yields or spot rates and time to maturity.
- Term premium: extra return investors demand for holding a longer-maturity bond instead of rolling over short-term bonds.
- Inversion: a curve shape where short-term yields are higher than long-term yields.
Case Study: Bajaj Finance and the Funding-Cost Message Hidden in the Curve
Bajaj Finance shows why the yield curve matters beyond bond traders: an NBFC has to price loans, manage funding mix and protect margins as rates move.

Situation: Bajaj Finance, like other large Indian NBFCs, funds a lending book through a mix of bank borrowings, money-market instruments, securitization and debt-market issuances. When rates rise, the short end of the curve can reprice quickly, while many customer loans and longer assets may reprice with a lag.
The move: The strategic response is not “borrow cheaper” - that is too shallow. The real play is asset-liability management: diversify funding sources, avoid excessive dependence on very short-term borrowing, match liability maturities with asset tenors, and price new loans with the current curve in mind.
The lesson: A steep or inverted curve changes the economics of lending. The primary driver of Bajaj Finance’s resilience is disciplined ALM and funding diversification, supported by strong underwriting, customer franchise, digital distribution and pricing power. The yield curve does not decide the business model, but it strongly influences net interest margin and risk appetite.
So what: For a lender, the curve is a pricing input, a risk signal and a balance-sheet discipline tool - all at once.
In India, the sovereign yield curve is shaped by RBI policy, CPI inflation, government borrowing, banking-system liquidity and demand from banks, insurers, mutual funds and foreign portfolio investors. A movement in the 10-year G-sec yield can influence corporate bond pricing because corporate spreads are usually quoted over comparable government securities. The strategic point: Indian companies do not borrow in isolation - their funding cost sits on top of the sovereign curve.
How AI Changes the Yield Curve
AI does not replace fixed-income judgment, but it changes how quickly analysts can connect macro news, central-bank language and curve movement.
- Faster macro signal extraction: LLMs can summarize RBI MPC statements, inflation commentary, US Fed language and bond-market research to detect whether the tone is hawkish, dovish or neutral.
- Curve scenario generation: ML models can simulate how the curve may shift under inflation surprises, liquidity tightening, fiscal borrowing changes or global yield shocks.
- ALM and treasury monitoring: Banks and NBFCs can use analytics to flag maturity mismatches, refinancing concentration and margin sensitivity under different yield-curve shapes.
Use NotebookLM: upload the latest RBI MPC statement, a company annual report and a recent bond-market article. Ask: “What yield-curve risks could affect this company’s funding cost, margins and capital allocation?” Then convert the answer into a 60-second interview response.
Interview Relevance
“The yield curve has become flat or inverted. What does that tell you, and how would it affect a bank, NBFC or corporate borrower?”
If you remember only one line, say this: “The yield curve is a market-implied story about future rates, growth and risk - and its business impact shows up through funding cost, valuation and balance-sheet decisions.”
Common Mistake
The biggest mistake is saying “an inverted curve means recession” as if it is a law. It costs candidates because it ignores country context, central-bank policy, liquidity, term premium and market structure. Fix: say “inversion is a warning signal of tight policy and weaker growth expectations, but I would confirm it with inflation, credit growth, liquidity and central-bank guidance.”
What to Revise Next
Now move from reading the curve to understanding the instruments and market where it lives. Revise these next: