
The Metrics That Define Agriculture & Food Performance
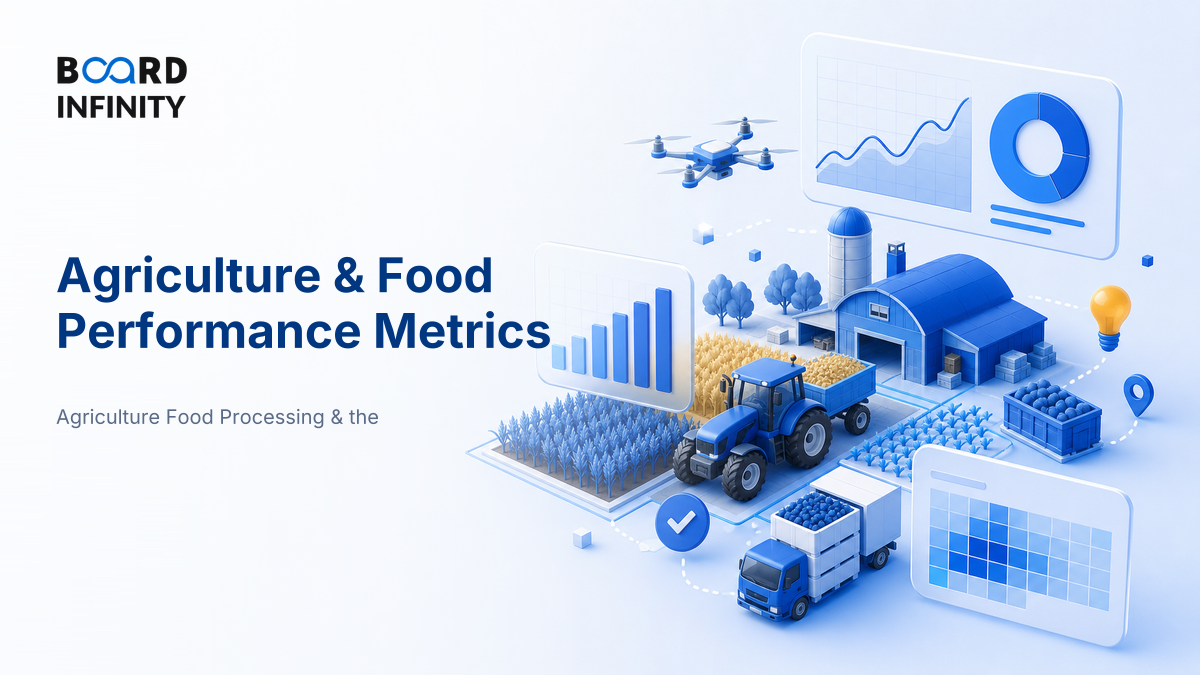
A tomato can leave a farm looking perfect and still destroy value before it reaches the shelf - one delayed truck, one missed temperature check, one rejected crate. Agriculture and food performance is not measured only by yield; it is measured by how much biological output survives the chain, meets quality, and converts into cash.
- Do not stop at yield. Agriculture and food performance runs from farm productivity to procurement, processing, cold chain, food safety, inventory, and margins.
- The core equation: performance = biological output × quality × supply reliability × realization × cost efficiency.
- Best interview metrics: yield per hectare, input cost per kg, post-harvest loss %, OTIF, rejection rate, inventory turns, gross margin %, and cash conversion cycle.
- Use benchmarks carefully. “Good” varies by crop, season, geography, and channel; compare against the same crop-category-market combination.
- Food is perishable inventory. A small spoilage or rejection change can have a bigger profit impact than a small sales increase.
- AI improves measurement first, decisions second. Forecasting, grading, route planning, and quality prediction only matter if they reduce waste or improve realization.
The Big Picture: Performance Is a Chain, Not a Farm Metric
In agriculture and food, value is created in one place and often lost somewhere else. A farm may improve yield, but if procurement is late, grading is poor, or the retailer rejects stock, the business still underperforms.
Use these six chain-level measures as your first dashboard. The benchmark ranges below are interview heuristics, not universal standards; always adjust for crop, season, perishability, and channel.
Core Explanation: The Metrics That Actually Define Performance
Think of agriculture and food metrics in four buckets: farm productivity, supply chain reliability, quality and safety, and financial conversion. A strong answer links all four.
The strongest candidates do not list twenty KPIs. They choose the few that explain the business model. A dairy processor, a fresh produce marketplace, and a packaged snack company will not have the same top metric.
For perishables, the operating metric that often hides profit leakage is post-harvest loss. A small improvement can free up saleable volume without buying more crop. For packaged food, the hidden metric is often inventory freshness: old stock increases discounting, returns, and retailer pushback.
A fresh produce supplier selling to hotels, restaurants, or modern trade must measure OTIF, rejection rate, grade mix, and shelf-life remaining, not just procurement volume. This is why food supply chains need the same operating discipline as logistics networks; if that value-chain logic feels weak, revise how the aviation and logistics value chain works.
Definitions: The Words Interviewers Expect You to Use Correctly
- Yield: agricultural output produced per unit of land, usually measured as kg or tonnes per hectare.
- Post-harvest loss: the share of harvested output lost before sale because of damage, spoilage, shrinkage, or rejection.
- OTIF: the percentage of orders delivered on time and in the full ordered quantity.
- Conversion yield: saleable finished output produced from a given quantity of raw agricultural input.
- Net realization: actual revenue earned per kg after discounts, deductions, wastage, and channel costs.
The Metric Stack: From Compliance to Profit
Agriculture and food metrics form a stack. You cannot optimize profit sustainably if the lower layers - safety, traceability, and quality - are weak.
Worked Example: One Metric Change, Real Profit Impact
Assume a fresh produce company procures 10,000 kg of vegetables at ₹20 per kg. It sells accepted output at ₹28 per kg. Earlier, 12% of quantity was lost or rejected; after better grading and faster dispatch, loss falls to 8%.
The lesson: a four percentage-point reduction in loss increased gross profit without increasing procurement quantity. That is why wastage, rejection, and conversion yield are not “operations-only” metrics; they directly affect unit economics.
The Interview Trick: Link Operating Metrics to Financial Outcomes
The best answer translates operational movement into P&L movement. Do not say “OTIF improved” and stop. Say what it does to revenue, cost, working capital, and risk.
Case Study: DeHaat and the Full-Stack Agritech Metric View
DeHaat matters because it shows how an agriculture platform must track farmer-side productivity, input distribution, advisory, procurement, and market linkage together.
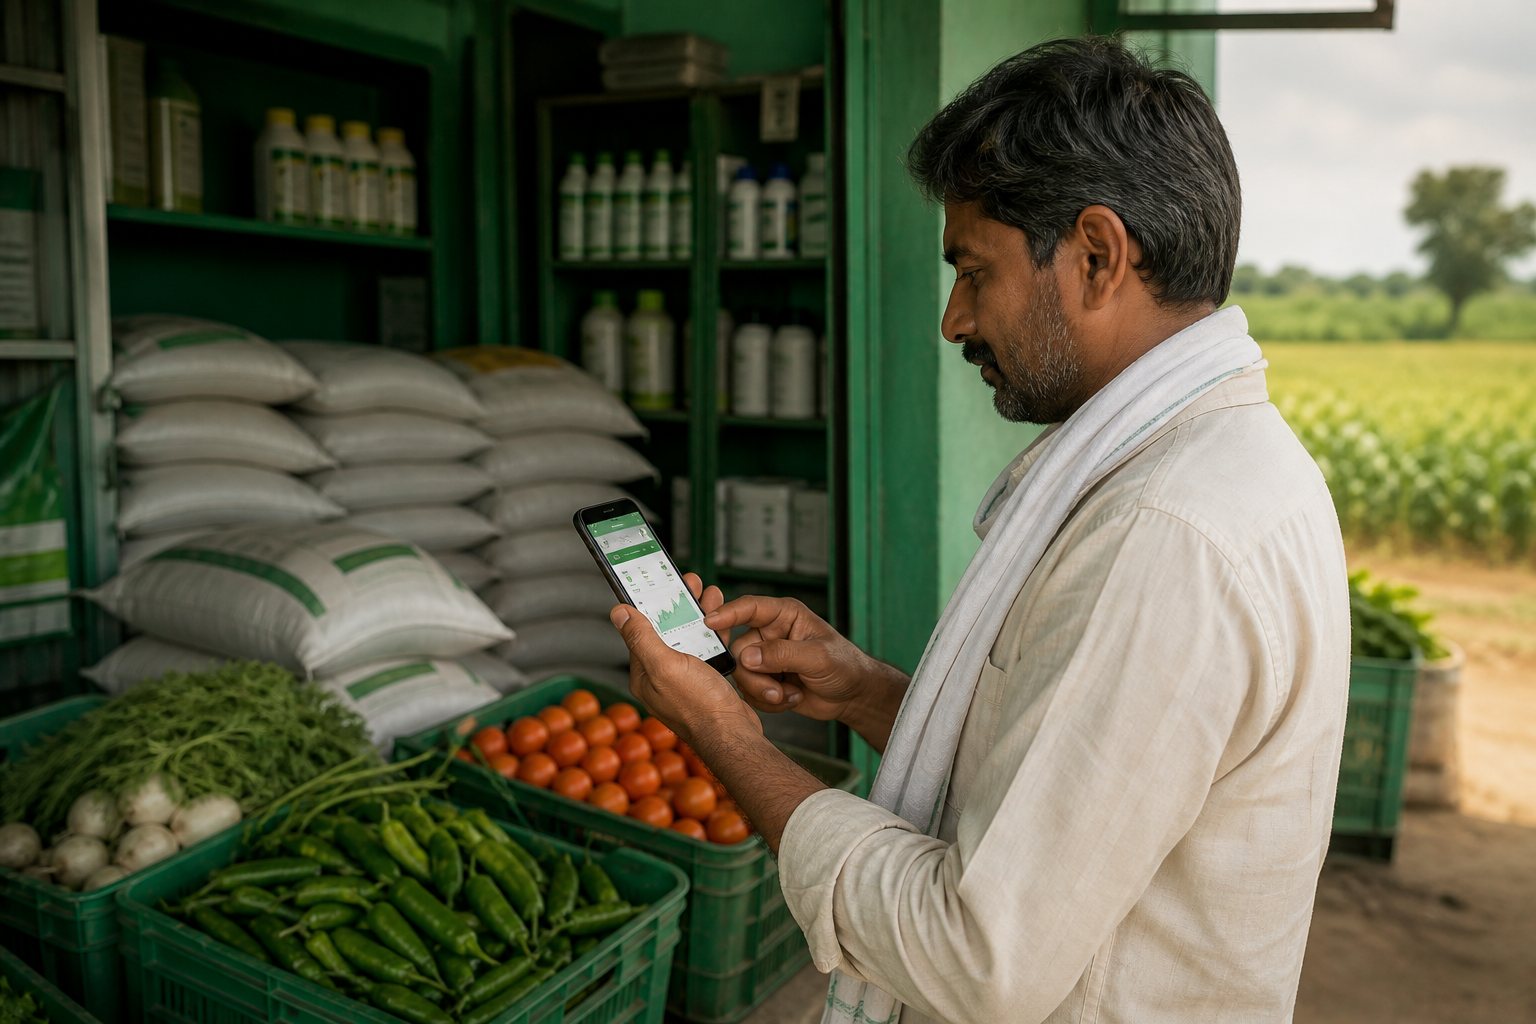
Situation: Indian smallholder agriculture is fragmented across input purchase, advisory, credit, harvesting, and market access. A farmer may buy inputs from one source, receive advice from another, sell to a trader, and have little visibility on final realization.
The move: DeHaat built a full-stack agritech model around farmer services, crop advisory, input access, financial linkages, and output market linkages. The important management point is not “app for farmers.” It is that one platform can observe multiple performance levers across the crop cycle.
Outcome or lesson: The primary driver is integrated visibility across the farm-to-market journey. Supporting drivers include physical touchpoints, advisory data, buyer linkages, and repeat transactions. The strategic lesson is simple: in agriculture, the winning metric system connects farmer success with platform economics; measuring only GMV or procurement volume gives a shallow picture.
How AI Changes Agriculture & Food Performance Metrics
AI is changing agriculture and food metrics in three practical ways. First, computer vision can grade produce more consistently than purely manual inspection. Second, machine learning can improve demand forecasts for perishable inventory. Third, route and cold-chain optimization can reduce spoilage risk by matching dispatch timing, temperature sensitivity, and delivery windows.
Practical student workflow: Use ChatGPT or Claude to build a metric tree for a company before an interview. Prompt: “For this agriculture or food company, map farm, procurement, processing, distribution, and financial metrics. Show which three metrics would most affect EBITDA and working capital.” If you have an annual report, load it into NotebookLM and ask for evidence-backed interview questions on inventory, margins, and procurement risk.
Interview Relevance
“If you were evaluating the performance of an agriculture or food company, which metrics would you track and why?”
If the interviewer pushes for “one metric,” do not say revenue. Say: “For perishables, I would start with post-harvest loss percentage because it links farm output, logistics discipline, quality, and gross margin.”
Common Mistake
The mistake: treating agriculture performance as only yield or only revenue. Why it costs candidates: it ignores quality, wastage, perishability, service level, and working capital - the actual drivers of food economics. One-line fix: always connect farm metrics to supply chain metrics and then to margin or cash flow.