Box Plot in Python using Matplotlib

Introduction
Matplotlib is the most widely used data visualisation package in Python, however there are many more. The popularity of Matplotlib is a result of its dependability and usefulness; with little code, it can produce both straightforward and intricate charts. The plots may also be altered in a number of different ways. We'll go through how to plot box plots with Matplotlib in this tutorial.
Box plots, which show characteristics of the distribution such as the data's range and distribution, are used to illustrate summary statistics of a dataset.
Importing Data
We'll need some data to plot before we can make a box plot. Since Boxplots show the distribution of continuous variables, we must select a dataset with continuous variables as features. We'll be using the dataset for wine quality. To read and interpret the dataset, we'll import Pandas. Naturally, we'll also need to import Matplotlib, or more precisely, the PyPlot module:
Let's verify that our dataset is prepared for usage. In order to verify that the data has been imported correctly and that there are no missing data items, we will print out the dataset's head:
There is no missing data because the second print statement returns False. If so, we would need to deal with missing DataFrame values.
Plot a Box Plot in Matplotlib
Let's use the boxplot() method to illustrate a few of the dataset's characteristics that we have chosen. For simplicity, we'll use Pandas to extract the desired feature columns and save them as variables:
As usual, we may use the PyPlot instance (plt), Figure instance, or axes instance to call plotting functions:
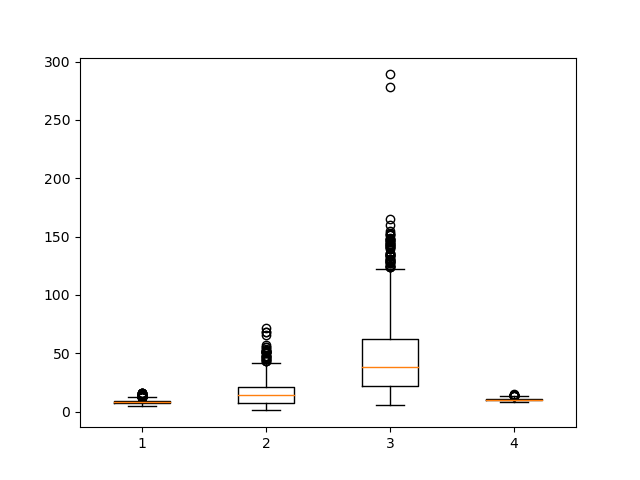
The fig and axe objects have been removed from the subplots() method's return so that we may use any of them to use the boxplot() function in this case. Instead, we might have just called plt.boxplot (). Whatever the situation, this leads to:

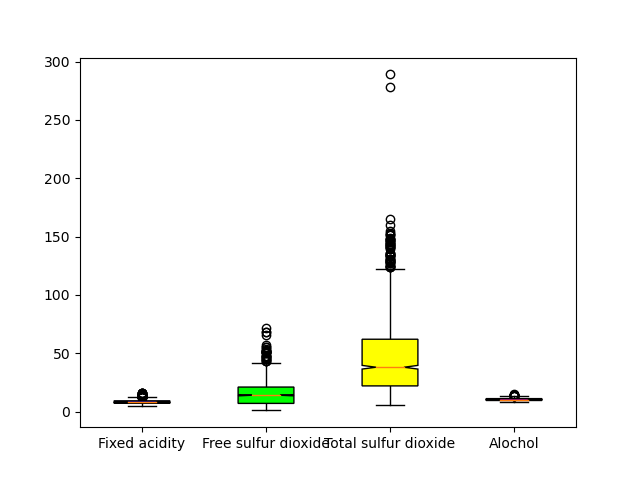
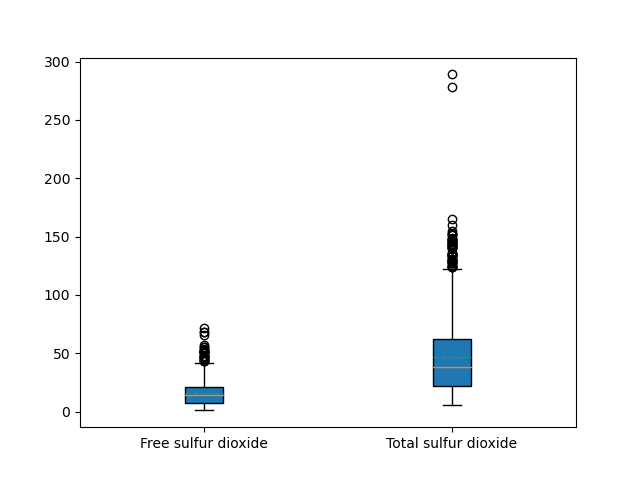
We may view some of the summary statistics for our data after making the graphic. The Box Plot displays the interquartile ranges (the ends of the boxes), lowest and maximum values of the selected dataset characteristic, as well as the median of the dataset (the vertical line in the centre) (the far end of the "whiskers"). By adding extra columns, we may also plot numerous columns on a single figure. Again, you can perform this on the fig object, the axe object, or the plt instance:
Customising The Plot
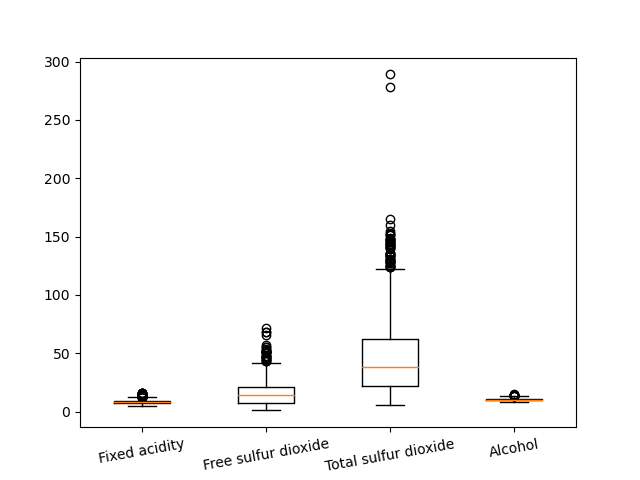
While the plots were successfully created, the graph is difficult to comprehend without tick labels on the X and Y axes. Using the xticks method, we can modify the plot and add labels to the X-axis. We'll add the labels for each of those columns after passing in the quantity of labels we wish to add:
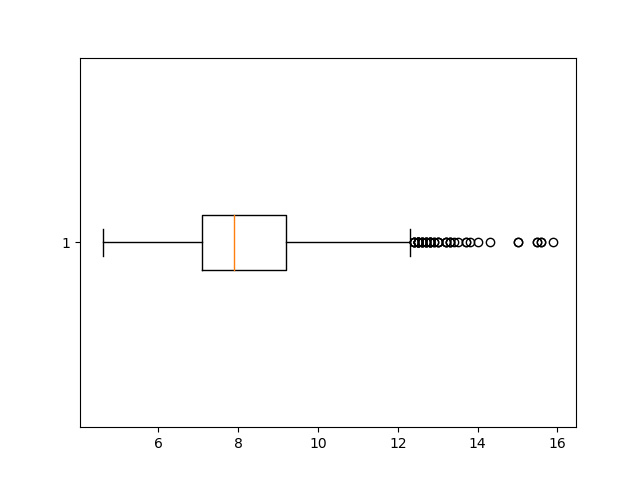
The vert parameter can be used to adjust the plot's orientation if we so want. The value of vert, which by default is set to 1, determines whether the plot is presented vertically:
The box plot's notch=True property adds a notch format, and patch artist=True fills it with colour:

The meanline parameter may be used to display the mean on the box, however it is best to avoid doing so if we are also showing notches since they could clash. Along with the showmean argument, this is required. If it is practicable, the mean will be shown as a line that spans the whole box. If that's not feasible, the average will be shown as a number of points:
By compiling a list of hex colour values and utilising the set facecolour parameter, we can tint the various feature columns. The colours we wish to utilise are zip-filed with the boxes element of the box variable in the example below, and then we set the face colour for each of those boxes.