Linear Regression in Python

Introduction
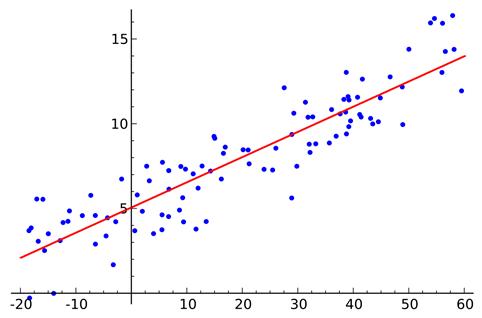
You will discover what linear regression is in this blog article as well as how to use NumPy, scikit-learn, and statsmodels, three open-source Python tools, to implement it. Regression looks for connections between different variables. Our aim is to find a function that adequately translates certain traits or parameters to a noticeable pattern from which we can draw a conclusion. The regression analysis, outputs, or reactions are referred to as the dependent features. The control variables, inputs, regression coefficient, or predictor are names for the independent characteristics.
Linear Regression Analysis
One of the most crucial areas of machine learning and statistics is regression analysis. Numerous regression techniques are available. Another one of them is linear regression. NumPy will be used in this case to manage arrays. The following methods are used to achieve linear regression:
- scikit-learn: If you wish to utilize a method congruent with other regression approaches and don't require comprehensive findings
- statsmodels: if you want a model's sophisticated statistical parameters.
The major steps involved in Linear Regression are:
- import the classes and packages you require
- Providing data for use will allow you to do the necessary modifications afterwards.
- Make a regression model, then use the data to fit it.
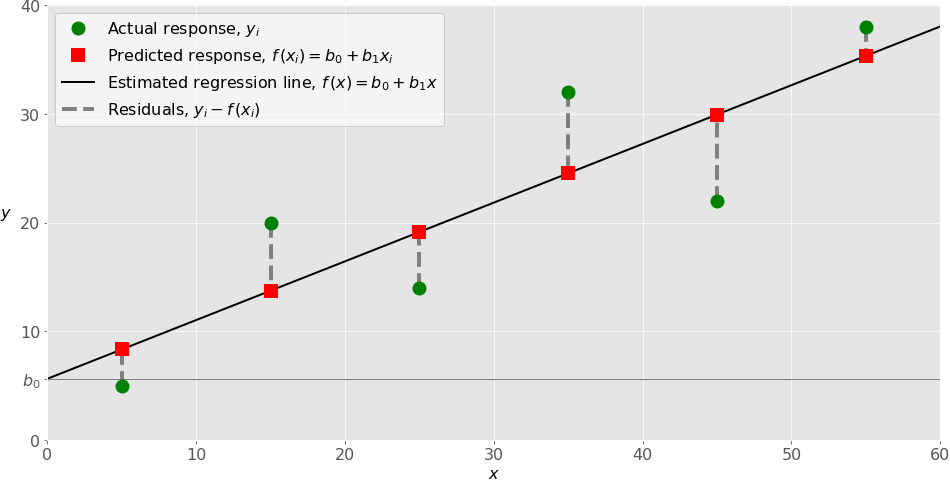
- To determine whether the model is appropriate, look at the results of model fitting.
- Use the model to make predictions.
In this code example, a linear regression model is built using information from a numpy array. The coefficients are calculated, and the console then displays them:
Explanation
The LinearRegression class is first imported in a Python script:
from sklearn.linear_model import LinearRegression
sklearn.linear_model.LinearRegression()
Despite not being displayed in the script, the class has default parameters that handle the labor-intensive tasks for basic linear regression:
sklearn.linear_model.LinearRegression(fit_intercept=True, normalize=False, copy_X=True)
Parameters:
fit_interceptbool, default=True
Determine the model's intercept. If set to False, the computation won't include an intercept.
normalizebool, default=False
Transforms a value entered into a boolean.
copy_Xbool, default=True
copies the value of X. X will be transferred if True; else, it could be overwritten.
Regression Vs Classification
Regression's output variable is continuous, but classification's output is discrete, and this is the major distinction between the two. Quantity is predicted by regression; labels are predicted by categorization.
That’s it for this article. You can check other Board Infinity's blogs related to Python and data science related tutorials. In this blog, we learned how to fit a model based on Linear Regression in Python using the Sci-Kit Learn library and the parameters that come into play while experimenting with it. We also saw a simple code example that demonstrates all the theory that was introduced to you. Hope you found it useful!