
Freight Rates, Cost per Unit Moved & Load Optimisation
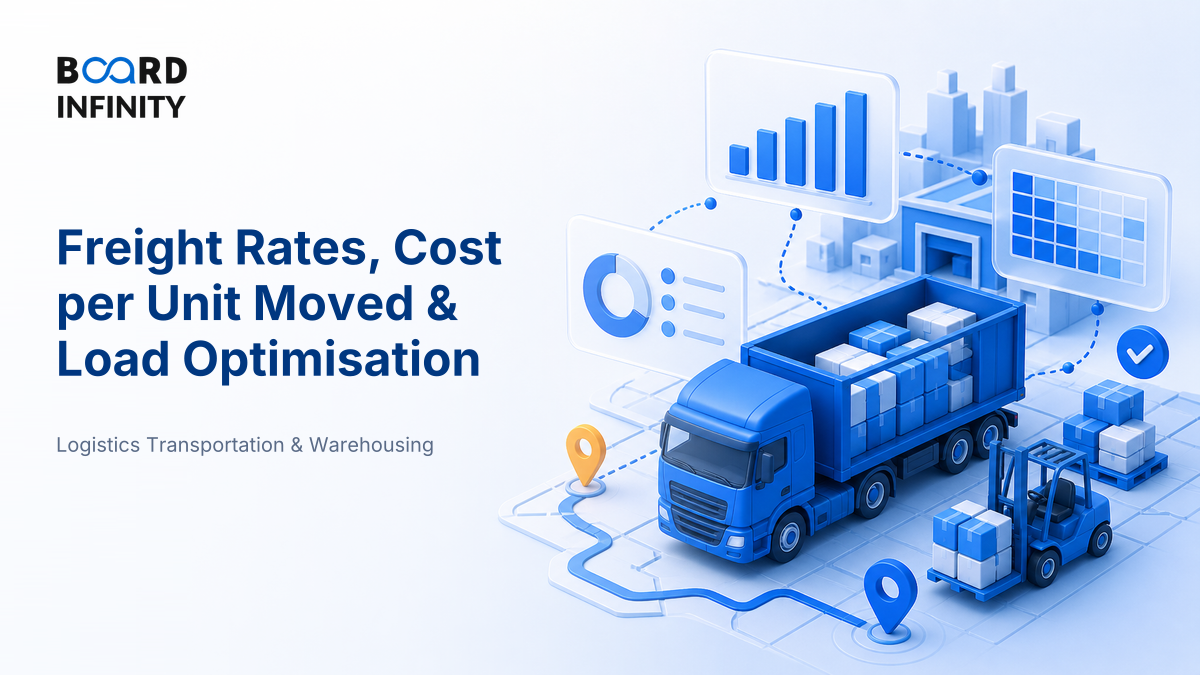
A truck full of potato chips can run out of space long before it runs out of weight. The same truck carrying tiles may hit its legal weight limit while looking half empty. That is the heart of freight economics: the rate you negotiate matters, but the load you build often decides the real cost.
- Freight rate is the price basis for transport - per kg, per ton, per vehicle, per km, per shipment or per slab.
- Cost per unit moved is the better business metric: total freight cost divided by kg, cases, pallets, orders or revenue units moved.
- A cheaper truck rate can still be expensive if utilisation is poor, detention is high or damage increases.
- Load optimisation improves the denominator safely - more saleable units per trip without breaking weight, cube, route, legal or service constraints.
- Always separate linehaul cost from accessorials: detention, fuel surcharge, tolls, loading, unloading and special handling.
- The strongest interview answer moves from rate card to total landed logistics cost, then checks service impact.
- The common trap: optimising “cost per truck” instead of “cost per unit delivered on time and undamaged”.
Big Picture: Freight Cost Is a System, Not a Quote
Think of freight cost as a left-to-right chain. Demand creates shipments, shipment characteristics decide the applicable rate, the load plan decides utilisation, and the final metric is cost per unit moved.
Core Explanation: The Three Ideas You Must Connect
Freight rates, cost per unit moved and load optimisation are not three separate topics. They are three layers of the same decision.
1. Freight rate: the price basis
A freight rate is the pricing rule used by the carrier. It may look simple - “₹ per truck” or “₹ per kg” - but the commercial meaning depends on the contract terms.
In procurement terms, a freight rate card is only the starting point. The real negotiation includes fuel surcharge logic, detention-free hours, loading responsibility, escalation clauses and service penalties - the same idea behind negotiation levers beyond price.
2. Cost per unit moved: the business metric
Cost per unit moved asks: “After all freight-related costs, how much did it cost to move one useful unit?” The unit can be kg, case, pallet, order, litre, vehicle, carton or revenue rupee - choose the unit that matches the business decision.
Formula: Cost per unit moved = Total freight cost ÷ Units moved.
Total freight cost should include linehaul, loading and unloading, tolls, fuel surcharge, detention, special handling, damage-related freight rework and reverse movement if relevant.
3. Load optimisation: improving cost without blindly cutting rates
Load optimisation means choosing the right vehicle, combining compatible shipments, arranging product safely and sequencing drops so that capacity is used well without hurting service.
The keyword is safe utilisation. A badly optimised load may look efficient at dispatch but create product damage, unloading delays or failed deliveries.
FTL vs PTL: The Trade-Off Behind Many Freight Decisions
Most practical freight decisions compare FTL - full truckload - with PTL/LTL - part truckload or less-than-truckload. FTL gives control and speed when the vehicle is well filled. PTL avoids paying for unused capacity when demand is fragmented.
Key Metrics to Track Freight Performance
Use these metrics together. A low freight rate with weak utilisation, high detention and poor OTIF is not a good logistics outcome. Ranges below are practical interview heuristics; actual benchmarks vary by industry, lane, vehicle type, product density and service promise.
Worked Example: Why a Higher Truck Rate Can Reduce Cost per Case
Suppose a Pune to Bengaluru shipment has 11,000 cases. A carrier quotes ₹48,000 for the truck. Tolls and handling add ₹4,000. Because loading misses the slot, detention adds ₹3,000.
Total freight cost = ₹48,000 + ₹4,000 + ₹3,000 = ₹55,000.
Cost per case = ₹55,000 ÷ 11,000 = ₹5.00 per case.
Now suppose planning consolidates compatible demand and fills the truck with 14,000 cases. The better-suited vehicle and planned loading slot cost ₹52,000, tolls and handling remain ₹4,000, and detention is avoided.
Total freight cost = ₹52,000 + ₹4,000 = ₹56,000.
Cost per case = ₹56,000 ÷ 14,000 = ₹4.00 per case.
The quoted truck rate increased, but cost per case fell by 20%. The primary driver was higher load utilisation, supported by consolidation and better loading-slot discipline.
Definitions You Can Say in One Breath
- Freight rate: Price charged to move a shipment on a lane under agreed service, weight, volume and liability terms.
- Cost per unit moved: Total transport cost divided by physical or commercial units moved, such as kg, case, pallet or order.
- Load optimisation: Planning vehicles, consolidation and loading sequence to maximise safe utilisation while meeting delivery, product and legal constraints.
- Chargeable weight: The greater of actual weight and volumetric weight used to price space-constrained freight.
- Accessorials: Extra charges beyond linehaul, such as detention, loading, tolls, fuel surcharge or special handling.
Delhivery: Consolidation Economics in Indian Freight
Delhivery shows why Indian freight cost improves when fragmented shipments are converted into dense, planned network flows rather than treated as isolated truck bookings.
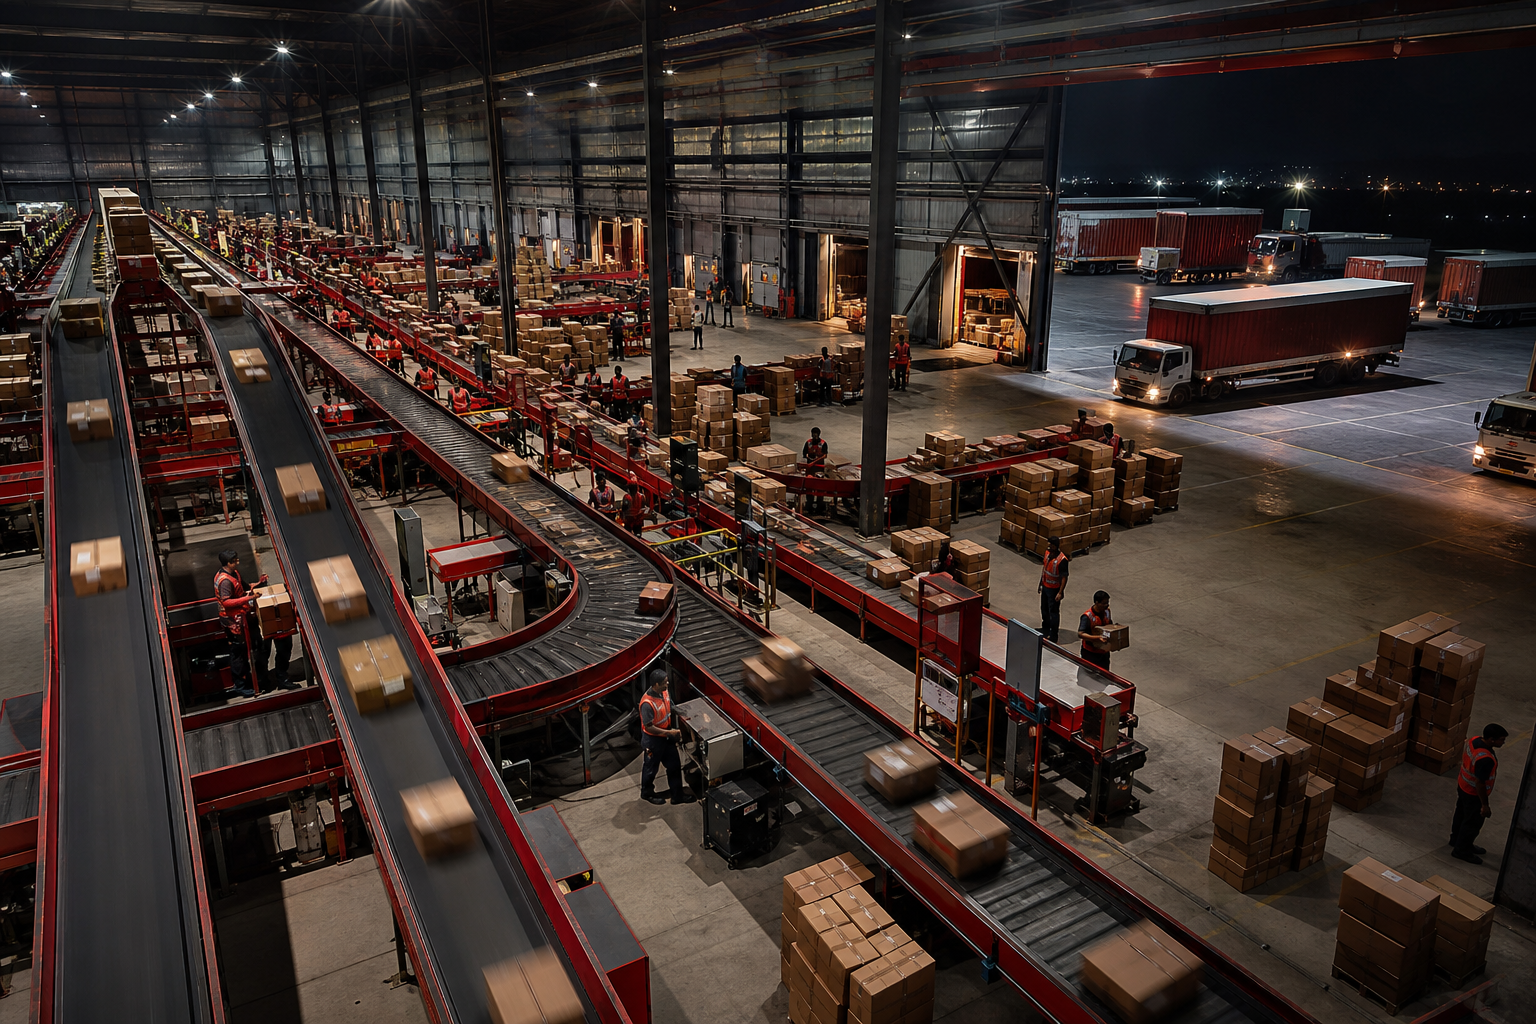
The situation is familiar in Indian logistics: thousands of sellers and businesses move shipments that are individually too small for efficient full-truckload movement. If each shipper books capacity independently, trucks run underfilled, rates are hard to compare and accessorial leakages are easy to miss.
Delhivery built its business around network logistics across express parcel, part-truckload and truckload services, as described on its official investor relations page. The strategic move is not just “more trucks”. It is consolidation: collect many small shipments, sort them through hubs, build dense linehaul movements, and choose between PTL and FTL depending on lane volume and service promise.
The primary driver of freight efficiency here is network density - more compatible shipments flowing through the same lanes and nodes. Supporting drivers include technology visibility, hub-and-spoke design, linehaul planning, shipment tracking and standardised operating processes. Together, these convert irregular demand into more predictable capacity utilisation.
Takeaway: The best answer is not “Delhivery saves cost because it uses technology.” A sharper answer says network density is the main driver, supported by routing, sorting, visibility and standardised execution.
How AI Changes Freight Rates, Cost per Unit Moved & Load Optimisation
AI changes this topic by making freight planning more predictive, granular and constraint-aware. The basic economics remain the same; AI improves how quickly planners can find the best feasible option.
A practical student workflow: export a small lane-wise shipment file with columns such as origin, destination, carrier, truck type, freight cost, cases, kg, cubic metres, dispatch date and delivery status. Upload it to ChatGPT Advanced Data Analysis and ask it to calculate cost per case, weight utilisation, cube utilisation, detention share and outlier lanes. Then ask: “Which five lanes should a logistics manager investigate first, and why?”
AI also connects freight to inventory decisions. Smaller, more frequent replenishment may improve availability but hurt transport utilisation; larger shipments may reduce cost per unit but raise inventory holding. If you want that trade-off, revise using AI for inventory optimisation and replenishment.
Interview Relevance
“Your company has negotiated lower freight rates, but total logistics cost per case has increased. How would you diagnose the problem?”
Use one sentence that interviewers love: “I would not optimise freight rate in isolation; I would optimise cost per unit delivered on time and undamaged.”
Common Mistake
The costly mistake is treating the lowest freight rate as the best logistics decision. It costs candidates because it ignores utilisation, accessorials, service failures and product damage. The one-line fix: compare carriers and plans on total cost per unit delivered within the service promise, not on rate alone.