Top 50 Data Science Interview Questions And Answers

Introduction
Data Science is undoubtedly one of the most enthralling technologies to learn out there. Having been labeled the sexiest job field of the 21st century, its demand has grown stupendously in recent years.
Without a doubt, preparation for a Data Science interview is tough and it would require one to have a few Data Science Interview Questions and Answers to crack the tough nut.
In this blog, we bring to you the top 50 Data Scientist Interview Questions and Answers to help you ace your next Data Scientist interview!
Data Science Interview Questions And Answers
Q1. What do you understand about Machine Learning?
Machine Learning is a method of study in which algorithms, data, and statistical analysis are used to perform data-driven tasks by the computer by learning through observations and patterns.
Q2. What are the types of Machine Learning? Differentiate between them?
There are three types of Machine Learning-
- Supervised Machine Learning
- Unsupervised Machine Learning
- Reinforcement Machine Learning
- In Supervised Machine Learning, the use of labeled datasets is done. Using labeled data (the input and output are already arranged in the correct relative manner), the machine or model is trained, based on which it predicts the outcome or inference of new data.
- Contrary to Supervised Learning, we use unlabelled datasets to train the model in Unsupervised Machine Learning.
- Reinforcement Learning is also a type of Machine Learning in which the machine uses rewards and punishments to learn and classify the data into positive or negative.
Q3. What do you understand by Linear Regression?
Linear Regression is an ML algorithm that attempts to establish a linear relationship between two variables, x and y, using the best possible fit of the straight line.
The mathematical equation for this is y=mx+c, where y is the dependent variable, x is the independent variable, m is the gradient or slope, and c is the intercept.
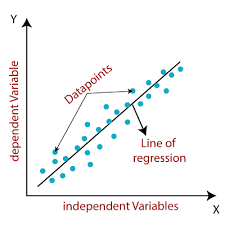
The figure above shows that not all the data points are available linearly or scalable as a linear straight line. Thus this algorithm finds the best possible way to fit the straight line covering the maximum possible data points.
Q4. Explain in brief what is meant by pruning?
Pruning means cutting or trimming. In data science, pruning refers to cutting the redundant or non-useful branches of a decision tree, making it smaller and more effective.
Pruning makes the decision tree better by increasing its accuracy and speed.
Q5. Explain Mean Squared Error?
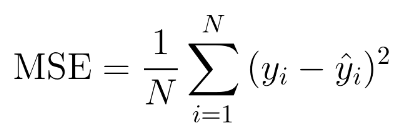
In simple terms, Mean Squared Error or MSE in machine learning tells us the distance between a specific, given set of data points and the regression line. These distances are the errors, and MSE is often used to ensure no major outliers in the model with huge errors.
The formula for MSE in mathematical terms is:
Q6. Name some frequently used Data Science Libraries?
Some of the frequently used data science libraries are PyTorch, TensorFlow, Pandas, SciPy, etc. These libraries are used for various uses such as parallel computing, data manipulation, solving various equations, etc.
Q7. What is a Decision Tree?
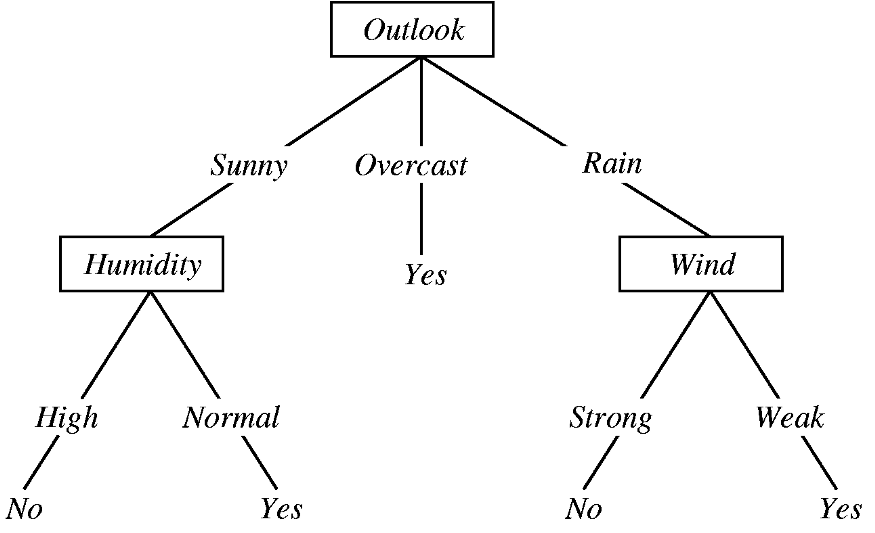
They are a type of Supervised machine learning algorithm. In a decision tree, the 'if-else' statement is used to make it work. It is a predictive model-based approach in which each condition is an internal node, which subsequently leads to different leaves or other conditions.
The visualization of a decision tree is as follows:
Q8. What do you understand by entropy in a decision tree algorithm?
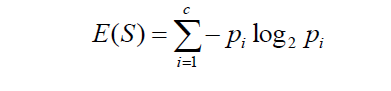
Entropy in machine learning refers to the degree of disorderliness or randomness of the data. In other words, it gives us an idea about the purity of a dataset. Entropy is the measure of variance.
The formula for entropy is:
Q9. What is the Gini Index?
Gini Index is a metric that is used in Classification and Regression Trees (CART). It is used to evaluate the split in a dataset as a cost function.
When a specific feature is selected at random, the Gini Index calculates the measure of the probability that the feature chosen is incorrect. The value of the Gini Index varies between 0 and 1.
Q10. What do you understand by information gain?
While building a decision tree, arriving at each node, we decide which feature or criteria would be best used to split our data such that we can make accurate predictions. It uses the concept of entropy. Essentially, we use information gain to measure the reduction in entropy when each decision is made. The higher the information gain, the better filter the feature is.
Q11. Briefly explain how a recommendation system works?
A recommendation system works based on the data collected from the target users based on their behavioral patterns. For example, if a user listens to rap music, the system will recommend rap music to the user. These recommendations can also be based on the behavior of similar users.
Q12. What is Selection Bias?
It is a bias commonly done while selecting data to train models. This is generally done when the focus is to build a model to solve only a specific problem or a part of a problem requiring only relevant data.
Q13. What are TPR and FPR?
True Positive Rate (TPR) is used to measure actual positives identified and their percentage. False Positive Rate (FPR) tells what the probability of false rejection of a null hypothesis will be.
Q14. What do you understand by Data Science?
Data Science is a field where a vast collection of raw data is analyzed and interpreted to arrive at meaningful results/observations/conclusions to solve some business problem.
Q15. Briefly explain Confusion Matrix?
The confusion matrix gives information about the performance of a classification model. It is an NxN matrix that evaluates the performance of a model. For binary classification, a 2x2 matrix is used.
Q16. What are Ensemble Methods?
Ensemble methods refer to a technique in which we combine several base models to build the most optimal model. In this, we combine several decision trees to produce an optimal predictive model.
Bagging and Boosting are the two different techniques to perform ensemble decision trees.
Q17. Explain the simplest way in which you can validate a predictive model generated using Multiple Regression?
The most common method to do this will be the cross-validation method. We split the data into two sets: Training and Testing Data and then perform the other steps.
The other method for this is Adjusted R-squared.
Q18. What do you mean by NLP?
Natural Language Processing or NLP is a subfield of Artificial Intelligence through which machines can learn, analyze, and understand human language.
Q19. What is the Accuracy and Misclassification Rate?
Accuracy is the sum of True Positive (TP) and True Negative (TN) divided by the sum of TP, TN, FP(False Positive), FN(False Negative).
Accuracy = (TP + TN)/(TP+TN+FP+FN)
Misclassification rate is defined as (FP+FN)/(TP+TN+FP+FN)
Q20. Random Forests vs. SVMs?
Random Forests are better than Support Vector Machines because-
- They are easier and faster to build
- SVMs cannot determine feature importance. Random forests can.
- SVMs require the one-vs-rest method in some cases, which is very memory sensitive.
Q21. Is a random forest a better model than a decision tree? Why?
Yes. This is because Random Forest is an ensemble method that combines various weak decision trees to make a more accurate model. This essentially means that 20 small decision trees are better than a larger one. This makes random forests less prone to overfitting.
Q22. What would you prefer, MSE or MAE?
MSE tends to focus too much on large deviations, which can make it seem that the model is incorrect if there are a few large outliers. Thus MAE is a better alternative than MSE.
Q23. Name some metrics used to verify if the regression model fits the data or not?
Some metrics used for this are-
- Adjusted R-squared
- RMSE (It is the absolute measure of fit)
- F1 Score (It evaluates the null hypothesis vs. alternative hypothesis)
Q24. What do you mean by P-Value?
P-value is used to determine the significance of output to the data. It shows the measure of the importance of the output to the data. It helps us decide to accept or reject a null hypothesis.
Q25. What is the Kernel Trick?
Some nonlinear problems often require us to transform them into linear ones to solve them. For this, some linear classifiers are used that transform non-linear data that are inseparable to linear-separable data in higher dimensions. This technique is called the kernel trick.
Q26. Explain Boosting?
It is one of the ensemble methods that help improve the model by reducing its variance and bias. Technically, we train a weak learner here and, in the process, generate a robust learning model by analyzing, learning, and improving from the mistakes.
Q27. Why is dimensionality reduction beneficial?
Data of higher dimensions are troublesome to deal with, as they take a lot of time to process and build models upon. Thus, dimensionality reduction help by reducing the size and dimension of the entire dataset while retaining the original info intact. This speeds up the process and also leads to better accuracy.
Q28. What do you mean by Statistical Power?
It refers to the probability that the test rejects the null hypothesis if the alternative hypothesis is true.
In mathematical terms,

Q29. How to deal with Outliers?
- Eliminate the extreme or irrelevant outliers that are irrelevant or wrong as per the given problem
- Use a non-linear model if a linear model isn’t satisfactory
- Normalize the data to shift the outliers closer to the other data points
- Using algorithms like random forests, which are not much outlier-sensitive
Q30. Explain about Mean Imputation?
Mean imputation refers to replacing null values in a given dataset with the mean value of the data.
Mean imputation should generally be avoided, because:
- It doesn’t account for feature correlation
- It reduces the variance of our data
- It increases bias of the data
- It leads to a less accurate model
Q31. Give examples of a few data that neither have gaussian distribution nor log-normal?
- Exponential data
- Categorical data- they won’t have either of the Gaussian or log-normal distribution.
Q32. When can the median be a better measure than the mean?
In cases of data where several outliers can affect or skew the data positively or negatively, the median is a better measure than the mean.
Q33. Describe Naive Bayes Algorithm. Why is there ‘Naive’ in its name?
Naive Bayes is a supervised ML algorithm based on Bayes’ Theorem, used to solve classification problems.
It is called ‘naive’ because it assumes that each variable in the dataset is independent of the other, which is very unlikely in the real world.
Q34. Explain the law of large numbers?
The law states that as we increase the number of trials, the average of the result will become closer to the actual value.
A practical example of this is that statistically speaking, on flipping a coin 100 times, the probability of a head occurring will be closer to 0.5 than in the case of flipping the same coin 50 times.
Q35. How to control biases?
To minimize biases, we can use randomization and random sampling. In randomization, each participant is assigned a chance, and in random sampling, each member can be chosen with equal probability.
Q36. State A/B testing?
It is a method to compare the two versions, i.e., the control and variant of a single variable. It is generally used to improve the user experience. It is a form of hypothesis testing and two-sample hypothesis testing.
Q37. Given random variable, X, mean = 1020, std. deviation = 50, find P(X>1200)
We use excel,
p= 1 - norm. Dist (50, 1020, 1200, true)
On solving,
p = 0.0015
Q38. State the Central Limit Theorem?
Whatever be the shape of the population distribution, as the sample size gets larger, the sampling distribution of the sample means approaches the normal distribution.
Q39. Name the biases that can be Inflicted on Sampling?
- Sampling bias
- Survivorship bias
- Undercoverage bias
Q40. What do you mean by Confounding Variables?
It is a variable that influences both dependent and independent variables. It causes a deceptive mathematical relation in which two or more variables are causally associated but not related.
Q40. Name all the kernel functions that can be used in SVMs?
- Sigmund Kernel
- Linear Kernel
- Radial Basis Kernel
- Polynomial Kernel
Q41. What is Root-Cause Analysis?
It is the process in which we figure out the root cause of a specific problem or failure. If while performing a series of steps, we arrive at one particular fault or error, upon the removal of which the problem is solved, then that problem is called the root cause.
Q42. What is TF/IDF Vectorization?
Time Frequency - Inverse Document Frequency is generally used in text mining. It is a numerical way to measure the importance of a word to a document in a corpus.
Q43. What do you understand by Cross-Validation?
Given a new dataset, we can use a technique called cross-validation to check or assess how well the model works on the new dataset. One General example of this is when we split the data into training and testing data and then use both for the respective purposes.
Q44. What if some assumptions of linear regression are violated?
Light or more minor violations will lead to more significant variance and bias, leading to error. Serious or strong violations will make the data entirely redundant and non-useful.
Q45. Define ROC Curve?
The Receiver Operating Characteristics curve is a plot between the TPR and FPR. It helps us Time-Frequency seek the correct tradeoff between TPR and FPR for different thresholds of the probability of the predicted values.
Q46. How can one define or select metrics?
- Regression vs. Classification?
- Precision vs. Recall?
- Objective and aim of the business
- Target value distribution
- MAE, MSE, Accuracy, recall, etc.
Q47. What are Tensors?
A tensor is an algebraic tool used to map linearly one set of objects to the other and describe it.
Tensors can map scalars, vectors, and recursively, even other vectors.
Q48. Explain Quality Assurance and Six Sigma?
Quality Assurance: It is a set of focus-driven activities to maintain a certain level of quality by eliminating or minimizing defects and errors.
Six-sigma: It is a particular quality assurance methodology in which greater than 99.99% of all outcomes are defects and error-free.
Q49. How can you detect if a time series data is stationary?
If we observe that the variance or mean for a given dataset does not vary with time, we can say that the time series data is stationary.
Q50. What is logistic regression?
It is a predictive statistical analysis which is a better form of regression analysis when the variable is binary. It uses prior data to establish a relationship between a dependent variable and one or more independent variables.
Conclusion
Having prepared rigorously for the role of a Data Scientist, it becomes even more necessary to add the perfect finishing touch to one’s preparation for that elusive score. This blog is aimed at helping you revise the top Data Science Interview Questions, and to help you add that cherry on the top of your cake!
If you want to start your career in data science from scratch, join our Data Science Course to become a Certified Data Scientist! Get access to 150+ hours of premium content and master the highly demanded technologies like SQL, Python alongside the concepts of Data Exploration, Regression Models, Hypothesis Testing. Get personalized 1:1 mentoring from top Data Science industry experts to be job-ready.
Social Media Marketing in India: Platform Selection Guide